Extras din proiect
1. Univariate analysis
a. Mode
Statistics
Are you a Starbucks customer? What's your gender?
N Valid 62 62
Missing 0 0
Mode 1 1
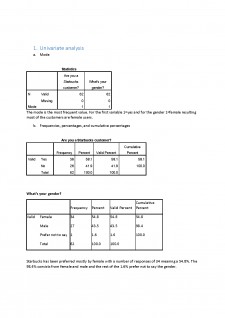
The mode is the most frequent value. For the first variable 1=yes and for the gender 1=female resulting most of the customers are female users.
b. Frequencies, percentages, and cumulative percentages
Are you a Starbucks customer?
Frequency Percent Valid Percent Cumulative Percent
Valid Yes 36 58.1 58.1 58.1
No 26 41.9 41.9 100.0
Total 62 100.0 100.0
What's your gender?
Frequency Percent Valid Percent Cumulative Percent
Valid Female 34 54.8 54.8 54.8
Male 27 43.5 43.5 98.4
Prefer not to say 1 1.6 1.6 100.0
Total 62 100.0 100.0
Starbucks has been preferred mostly by female with a number of responses of 34 meaning a 54.8%. The 98.4% consists from female and male and the rest of the 1.6% prefer not to say the gender.
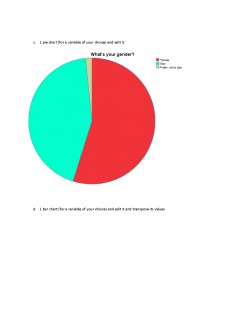
c. 1 pie chart (for a variable of your choice) and edit it
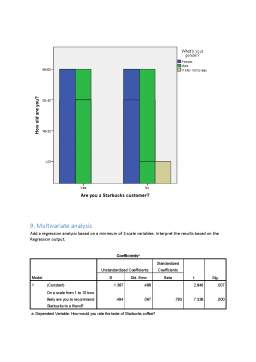
d. 1 bar chart (for a variable of your choice) and edit it and transpose its values
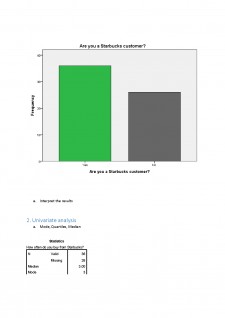
e. Interpret the results
2. Univariate analysis
a. Mode, Quartiles, Median
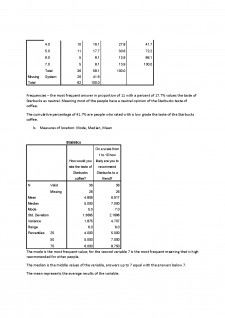
Statistics
How often do you buy from Starbucks?
N Valid 36
Missing 26
Median 3.00
Mode 3
Percentiles 25 2.00
50 3.00
75 3.00
The mode is the most frequent value, meaning the most of the people are neutral when it comes to when it comes to buy a Starbucks product.
The median is the middle value of an ordered (ascending or descending) array of data. The number 3 is dividing the options in equal parts, meaning the 4 means neutral.
The quartiles divide the array of data in 4 equal parts at numbers 2,3 and 3
b. Frequencies, percentages, and cumulative percentages
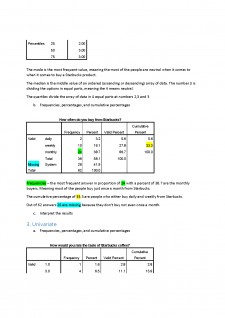
How often do you buy from Starbucks?
Frequency Percent Valid Percent Cumulative Percent
Valid daily 2 3.2 5.6 5.6
weekly 10 16.1 27.8 33.3
monthly 24 38.7 66.7 100.0
Total 36 58.1 100.0
Missing System 26 41.9
Total 62 100.0
Frequencies - the most frequent answer in proportion of 24 with a percent of 38.7 are the monthly buyers. Meaning most of the people buy just once a month from Starbucks.
The cumulative percentage of 33.3 are people who either buy daily and weekly from Starbucks.
Out of 62 answers 26 are missing because they don’t buy not even once a month.
c. Interpret the results
Preview document


Conținut arhivă zip
- Proiect SPSS.docx
Alții au mai descărcat și

Rezultatele din testul 3DS Max 7 SPECapc Test Testul alaturat consta in crearea modelelor 3D, modificarea si randarea scripturilor. Conform...

Introducere O semnatura digitala reprezinta o informatie care il identifica pe expeditorul unui document. Semnatura digitala este creata prin...

Caracteristici generale ale placii de baza Placa de baza este un dizpozitiv ‘de baza’ un ‘pamânt’ pe care ‘se planteaza’ celelalte componente ....

Acest sistem calculeaza gradul de avariere a unei cladiri în cazul unui cutremur, precum si posibila necesitate a reconstructiei cladirii (partiala...
Te-ar putea interesa și

CAPITOLUL 1 - INTRODUCERE Problema unui autovehicul ideal apare când clientul se hotărăște să cumpere un astfel de produs după criteriile tehnice...

CAPITOLUL I Introducere 1.1.Definirea problemei Piata jeansilor se diversifica mereu pentru ca apar firme noi care produc jeansi, modelele...

1. Introducere Generalităţi despre programul SPSS SPSS (Statistical Package for the SocialSciences) for Windows este un pachet de programe...

1.Introducere Programul SPSS este unul dintre cele mai utilizate în analiza statistică a datelor. Cu ajutorul acestui program am realizat analiza...

Proiect SPSS Am ales din Anuarul Statistic al României de pe site www.insse.ro/ 10 variabile aflate într-o oarecare dependenţă una de altă, pentru...

Descrierea statistică a variabilelor nominale Variabila nominala ce va fi analizata este Variabila SportQ13(„Care este aspectul care va...

Proiect SPSS Datele analizate in acest proiect sunt suprafata cultivate cu cereale pentru boabe si productia obtinuta in cele 41 de judete ale...

Folosind SPSS vom introduce datele și vom analiza: 1. Indicatorii medii și ai variației pentru suprafața cultivată și producția medie pe hectar de...