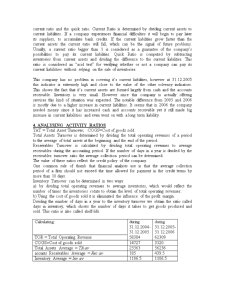
Extras din proiect
The company that I have analyzed is S.C. DIDACTIC PRES S.R.L., a publishing house, more 3 years old from Olt area in Romania. It is specialized in small circulation that is printing a smaller number of copies. The company’s object of activity corresponds to the CAEN code 2213. It is a small company and it started it’s activity in 2004. It usually takes it’s main revenues from the services rendered and works executed. I had also took this into consideration when I have analyzed it’s Balance Sheet and Income Statement. The period analyzed is of 3 years, covering all it’s activity from the beginning. The documents cover the balance and income statement from closing of 2004 and beginning 2005, information from the closing of the year 2005 and the beginning of 2006 and the closing of 2006. However, a comparison with the industry average evolution and stage was not possible due to severe lack of information available. In order to see also a broad general situation I have also commented on the indicators at a general level in a market.
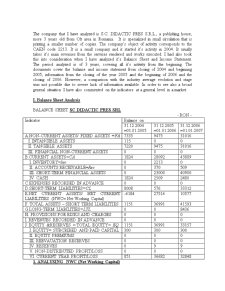
I. Balance Sheet Analysis
BALANCE SHEET SC DIDACTIC PRES SRL
- RON -
Indicator Balance on
31.12.2004
=01.01.2005 31.12.2005
=01.01.2006 31.12.2006
=01.01.2007
A.NON-CURRENT ASSETS/ FIXED ASSETS =FA 7335 9475 31016
I. INTANGIBLE ASSETS 115 0 0
II. TANGIBLE ASSETS 7220 9475 31016
III. FINANCIAL NON-CURRENT ASSETS 0 0 0
B.CURRENT ASSETS=CA 1824 28092 43889
I. INVENTORY=Inv 0 2213 0
II. ACCOUNTS RECEIVABLE=Rec 0 370 509
III. SHORT-TERM FINANCIAL ASSETS 0 23000 40900
IV. CASH 1824 2509 2480
C.EXPENSES RECORDED IN ADVANCE 0 0 0
D.SHORT-TERM LIABILITIES=CL 8008 576 33312
E.NET CURRENT ASSETS/ NET CURRENT LIABILITIES (NWC= Net Working Capital) -6184 27516 10577
F. TOTAL ASSETS – SHORT TERM LIABILITIES 1151 36991 41593
G.LONG-TERM LIABILITIES=LTL 0 0 8436
H. PROVISIONS FOR RISKS AND CHARGES 0 0 0
I. REVENUES RECORDED IN ADVANCE 0 0 0
J. EQUITY &RESERVES = TOTAL EQUITY= EQ 1151 36991 33157
I. EQUITY= SUBCRIBED AND PAID CAPITAL 300 300 300
II. EQUITY PREMIUMS 0 0 0
III. REEVAUATION RESERVES 0 0 0
IV. RESERVES 0 9 9
V. NON-DISTRIBUTED PROFIT/LOSS 0 0 0
VI. CURRENT YEAR PROFIT/LOSS 851 36682 32848
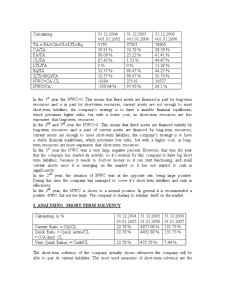
1. ANALYSING NWC (Net Working Capital)
Calculating: 31.12.2004
=01.01.2005 31.12.2005
=01.01.2006 31.12.2006
=01.01.2006
TA = FA+CA=CL+LTL+Eq 9159 37567 74905
CA/TA 19.91 % 74.78 % 58.59 %
FA/TA 80.09 % 25.22 % 41.41 %
CL/TA 87.43 % 1.53 % 44.47 %
LTL/TA 0 % 0 % 11.26 %
Eq/TA 12.57 % 98.47 % 44.27 %
(LTL+EQ)/TA 12.57 % 98.47 % 55.53 %
NWC=CA-CL -6184 27516 10577
NWC/CA -339.04 % 97.95 % 24.1 %
In the 1st year the NWC<0. This means that fixed assets are financed in part by long-term resources and a in part by short-term resources, current assets are not enough to meet short-term liabilities, the company’s strategy is to have a instable financial equilibrium, which presumes higher risks, but with a lower cost, as short-term resources are less expensive that long-term resources.
In the 2nd and 3rd year the NWC>0. This means that fixed assets are financed entirely by long-term resources and a part of current assets are financed by long-term resources, current assets are enough to meet short-term liabilities, the company’s strategy is to have a stable financial equilibrium, which presumes low risks, but with a higher cost, as long-term resources are more expensive that short-term resources.
In the 1st year the NWC was a very large negative percent. However, that was the year that the company has started its activity, so it’s normal for this company to have big short term liabilities, because it needs to borrow money so it can start functioning, and small current assets since it is emerging on the market so it has not started to cash in significantly.
Preview document


Conținut arhivă zip
- Financial Analysis of a Romanian Company.doc
Alții au mai descărcat și

I. Utilizarea impozitului ca instrument Cea mai mare parte a resurselor publice sunt prelevari obligatorii si de aceea se impune definirea...

Propuneri privind cotele de impozit pe profit Nu se pot încheia aceste scurte consideratii asupra cotei de impunere, fara a fi exprimata opinia...

Infiintarea bancii nationale a romaniei (1880) Banca Nationala a Romaniei este prima institutie de emisiune a statului roman independent....
Te-ar putea interesa și

REZUMAT Cuvinte cheie: analiză economică, diagnostic, bilanţ, întreprindere, potenţial Această lucrare are ca scop prezentarea analizei...

Chapter 1 Culture and international marketing Culture is part of the external influences that impact the consumer and represents influences that...

1. A short history of the Coca Cola company In the year 1886, the Coca Cola Company is founded. Pharmacist John Smith Pemberton from Atlanta,...

1. BUSINESS DESCRIPTION 1.1 History of the company The Rebels Group Company was created in 26 November 1999, in Brasov by Mister Ovidiu Guiu and...

I. INTRODUCTION The company that we chose for this project is S.C. ATHENAEUM CONSTRUCT S.A., an organization active on the Romanian constructions...

INTRODUCTION Financial assistance in the business environment is one of the key element in economic growth, and creating and developing a good...

In order to identify the banks role it is necessary to locate them within the financial system, as being the main part of it. But what is the...

1.Description of the company 1.1. History and evolution Ernst & Young is one of the largest firms in the world, offering an array of financial...